WiCa Heuristic Indoor Propagation Prediction Tool (WHIPP)
Request access
Please sign or register and then use the Contact form to request access.
Information
In today’s society, there is an increasing trend towards the use of wireless internet systems. WiCA has developed the WHIPP (WiCA Heuristic Indoor Propagation Prediction) tool, a tool able to predict wireless coverage in a home or work environment for a given set of access points on a certain floor level of a building. The calculation is based on the building’s geometry and the used materials. The tool also allows to automatically position wireless access points in order to meet a given coverage requirement in the different rooms of the building. It is developed for 802.11b/g, with an extension for the MIMO (Multiple Input Multiple Output) WLAN standard 802.11n. Two important issues were kept in mind during the development process:
- User-friendliness - The user interface of the application was developed using an iterative design process in close collaboration with usability experts.
- Accuracy - Measurement campaigns in four different buildings were executed to construct, tune, and validate the coverage calculation models.
The coverage calculation is based on a floor plan of the building, which can be obtained in three ways:
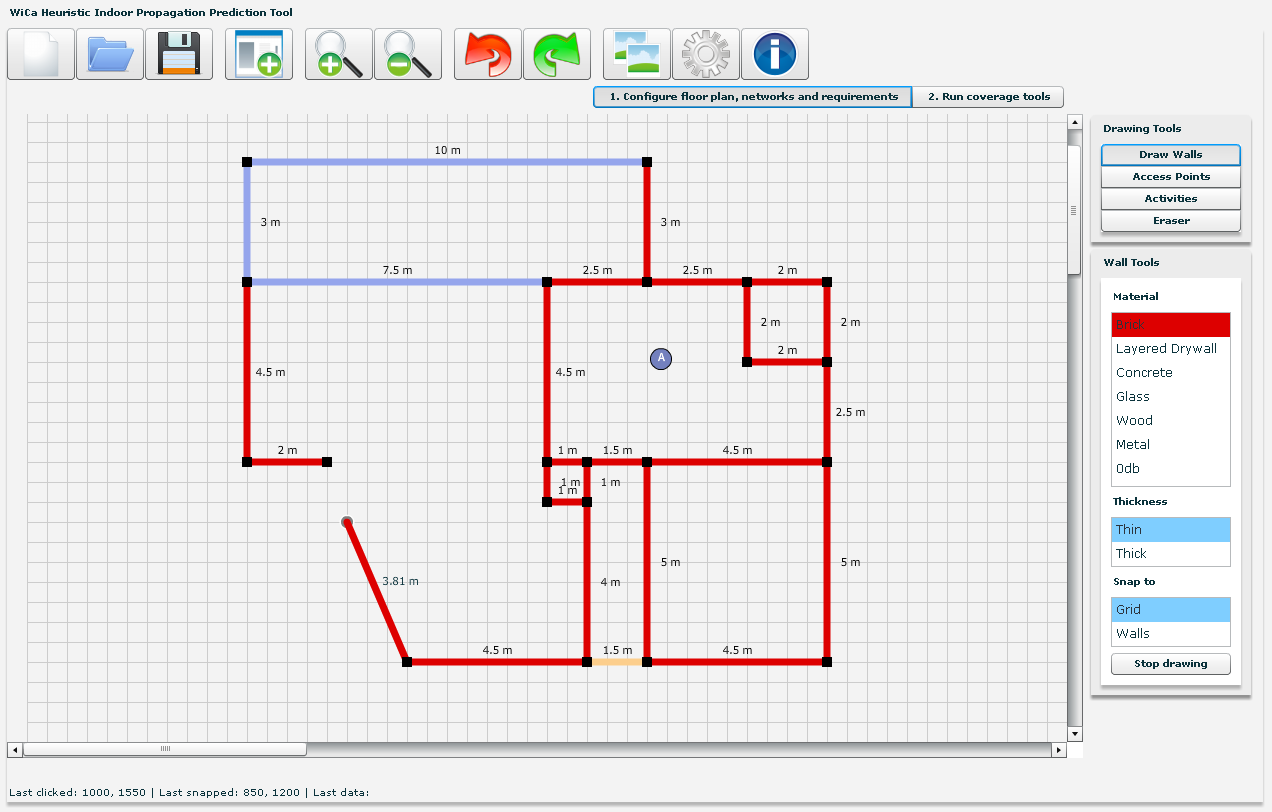
- Drawing a floor plan of their home or work environment. After selecting a building material (brick, layered drywall, concrete, glass, wood, or metal), the user draws individual walls onto a fixed grid. While the user is free to disable this constraint, the presence of a grid enables them to quickly create an accurate representation of the floor layout. To help with the drawing process, the tool supports standard operations such as ’erase’, undo/redo’ and ’zoom’.
- Importing existing ground plans.
- Tracing image scans. Existing building plans come in various digital formats and it is impossible to create conversion tools for all of them. Therefore, a feature that is similar to tracing paper is provided in the expert version of the drawing tool. An image scan of the floor plan can be displayed in the background, allowing the user to easily trace the walls. In a calibration phase, the user sets the scale of the image.

All created floor plans can be saved to the local system and opened later for further editing. Once the building plan is created, the user chooses the locations of the wireless access points. At this point, the tool has collected enough information to submit a path loss or throughput calculation request to the server.
- Path loss [dB], between an access point and a receiver device is the ratio of the transmitted power to the received power. It includes all of the possible elements of loss associated with interaction between the propagating wave and any objects (e.g., walls) between the transmitting and receiving antennas. To calculate the path loss, the dominant path between transmitter and receiver is determined. This is the path with the lowest attenuation (the lowest total path loss) when propagating from transmitter to receiver. It is assumed to 95% of the total energy is contained in this dominant path. Parameters influencing the total path loss are the distance along the path, the cumulated wall penetration losses for all walls traversed along the path, and the interaction loss or the loss caused by the bending of the path (around corners).
- The throughput [Mbps] is the data rate that is achieved over the wireless channel between access point and receiver device. It depends on the received power level, the receiver characteristics, the network load, and the technology. Different internet activities require different throughputs: video streaming causes a heavier load on the network than browsing or email.
The tool turns the predicted path loss or throughput into a colour-coded visualisation superimposed over the floor plan.
- This gives the user a clear view on the estimated wireless connection quality (coverage) in each area, as shown in the figure. Allows the user to quickly distinguish areas with adequate coverage from those with poor connectivity.
- Four intervals for throughput [Mbps] and path loss [dB] are defined, rendered respectively in red, orange, yellow, and green. Red areas may have adequate connectivity for streaming high definition video, while the yellow areas are only suited for web browsing.

The drawing tool is implemented in Adobe Flex 3. This has the following benefits:
- The tool is cross-platform. The Adobe Flash multimedia platform is well-established on Windows and OS X.
- No software installation is required. The drawing tool can be used on any computer with a current web browser and Adobe Flash installation.
- The Flex framework has an API for communicating with a remote server, such as a SOAP (Simple Object Access Protocol)-based web service.